

%20(1440%20x%20582%20px).avif)

New Zealand
Genetic gain is the improvement made within the flock (or herd), genetically. At the base of it, genetics set the potential for an animal, and the environment helps to achieve the potential. By improving the genetics, we set that potential higher than it was for the previous generation.
In general, the average of the offspring should be equal to the average of the parents. That is, if you select the top 40% of ewe hoggets, their progeny should all average within that 40% range. In theory, by selecting their top 40% as the next generation, it will put the progeny in the top 16% of the initial parents. However, in practice, it is a little more complicated than that, with multiple generations contributing to the pool of replacements, multiple trait selection occurring, and environmental effects masking some of the genetic effects.
Briefly, there are two aspects that make up the expression of a trait – genetics and the environment. The heritability of a trait indicates the amount of that trait that is influenced by genetics and passed on from one generation to the next. Environmental effects can range from temporary (were they first or last through the weigh crate on the day?) to permanent (born as a single in the first week of lambing versus as a triplet in the last week of lambing). Repeatability is how likely that trait is to be repeated next time it is measured.
Understanding each of the factors that determine genetic gain can help us accelerate our progress. Genetic gain is calculated using the selection intensity, accuracy of selection, and genetic variation within the population, all divided by the generation interval (see below). Increasing any of the first three will increase your genetic gain, as will decreasing the generation interval.
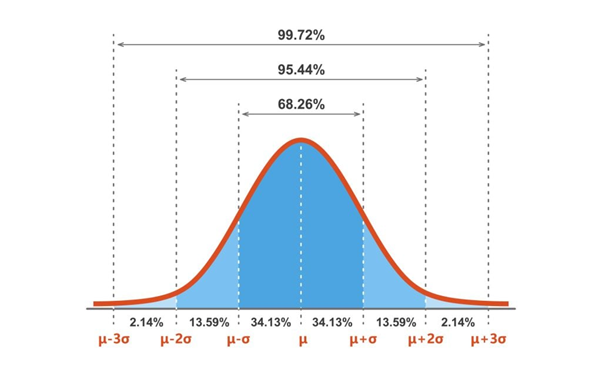
If you’re a visual learner, like I am, showing the difference on a standard bell curve really helps! Figure 1 shows the number of animals for a trait (e.g. weaning weight), within a normal distribution. We generally assume the base of the two axes is zero/the minimum measurement. The x axis shows the measurement (i.e. the weaning weight), and the number of times it occurs up the y axis. The mean (µ) sits in the middle of the bell, where more animals sit; while the extremes are where only a few animals sit. Without getting too into the maths behind it, 68% of the population will sit within one standard deviation (σ) either side of the mean, 95% within two standard deviations, and 99% within three standard deviations. The bell shape itself may be taller and skinnier, or shorter and fatter, but the principles still remain the same.
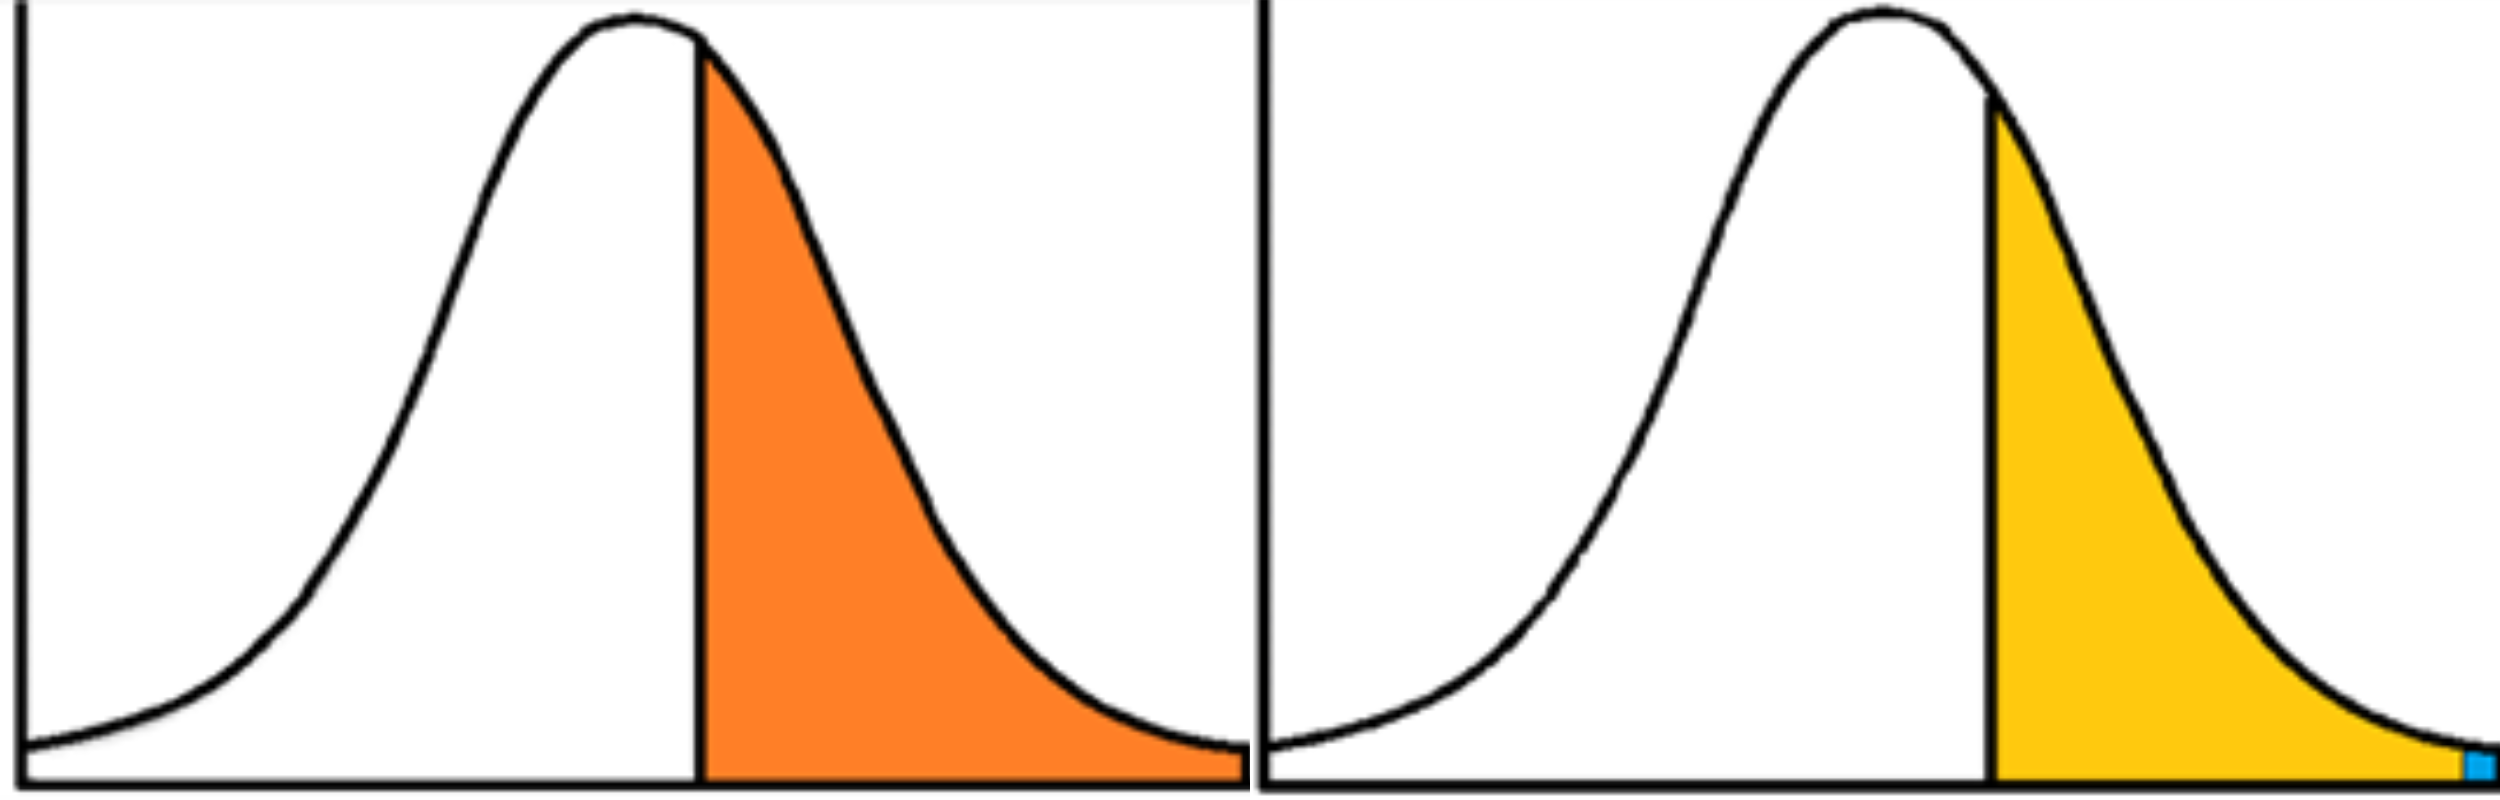
Selection intensity is a derivative of the proportion of animals selected. In the example below (Figure 2), you can see the difference between selecting 300 replacement ewe lambs out of 750 total weaned (top 40% selected - orange) and selecting those 300 out of 1000 ewe lambs (including the lambs born to hoggets) (top 30% selected - yellow).
Selecting parents for the next generation from the top end of the range will move the population in that direction (and the further towards that top end the selection occurs, the faster the gains will happen). The limiting factor with ewes is that selecting females requires numbers, with plenty needed as replacements each year (25-40% of your ewe numbers, depending on the farm’s policy).
Rams, on the other hand, generally have a really high selection intensity. Assuming you were selecting from your own lambs, 1000 ewes require about 10 rams. If there were 750 ram lambs, with only 10 selected, you would be selecting the top 1.3%, right at the far end of the bell curve (blue section within the yellow curve).
To actually achieve this selection intensity, you need accuracy of selection. How do you know that the rams you have selected are in the top 1.3%, or somewhere floating around in the middle?
Rams have the largest influence on the flock, due to the numbers of progeny they are producing. A ewe that isn’t within that top 40% (due to selection not being made accurately) will contribute 1-3 progeny per year, for a lifetime of 5 years. A ram on the other hand, mated to 100 ewes, weaning 140% will contribute 140 progeny PER YEAR for 3-4 years. Buying stud rams from farms that are recording multitudes of data is a great way to ensure the heavy hitters genetically are the best and are contributing positively to your flock. This is why it is important to understand the data going into your ram selections (another article to come).
So, how do you achieve accuracy of selection on a commercial farm? Generally speaking, in the strong-wool (or no wool) industry, your saleable product is lamb. There are two main factors that affect this: how many lambs are weaned per ewe mated, and how heavy are those lambs? Every farm will differ in this, and every farm will have their own sweet spot that achieves the best financial benefit. How you achieve that is up to you. But the common theme is: most product for least input.
So how does this trace back to accuracy? There are a few things that can be easily recorded to keep track of a ewe’s production, without necessarily needing a tag to record it:
The biggest gains here will be made through the selection of the rams. Even if selection within the ewe flock is random, progress can still be made by ensuring that ram selection is done with accurate data for the traits you are interested in.
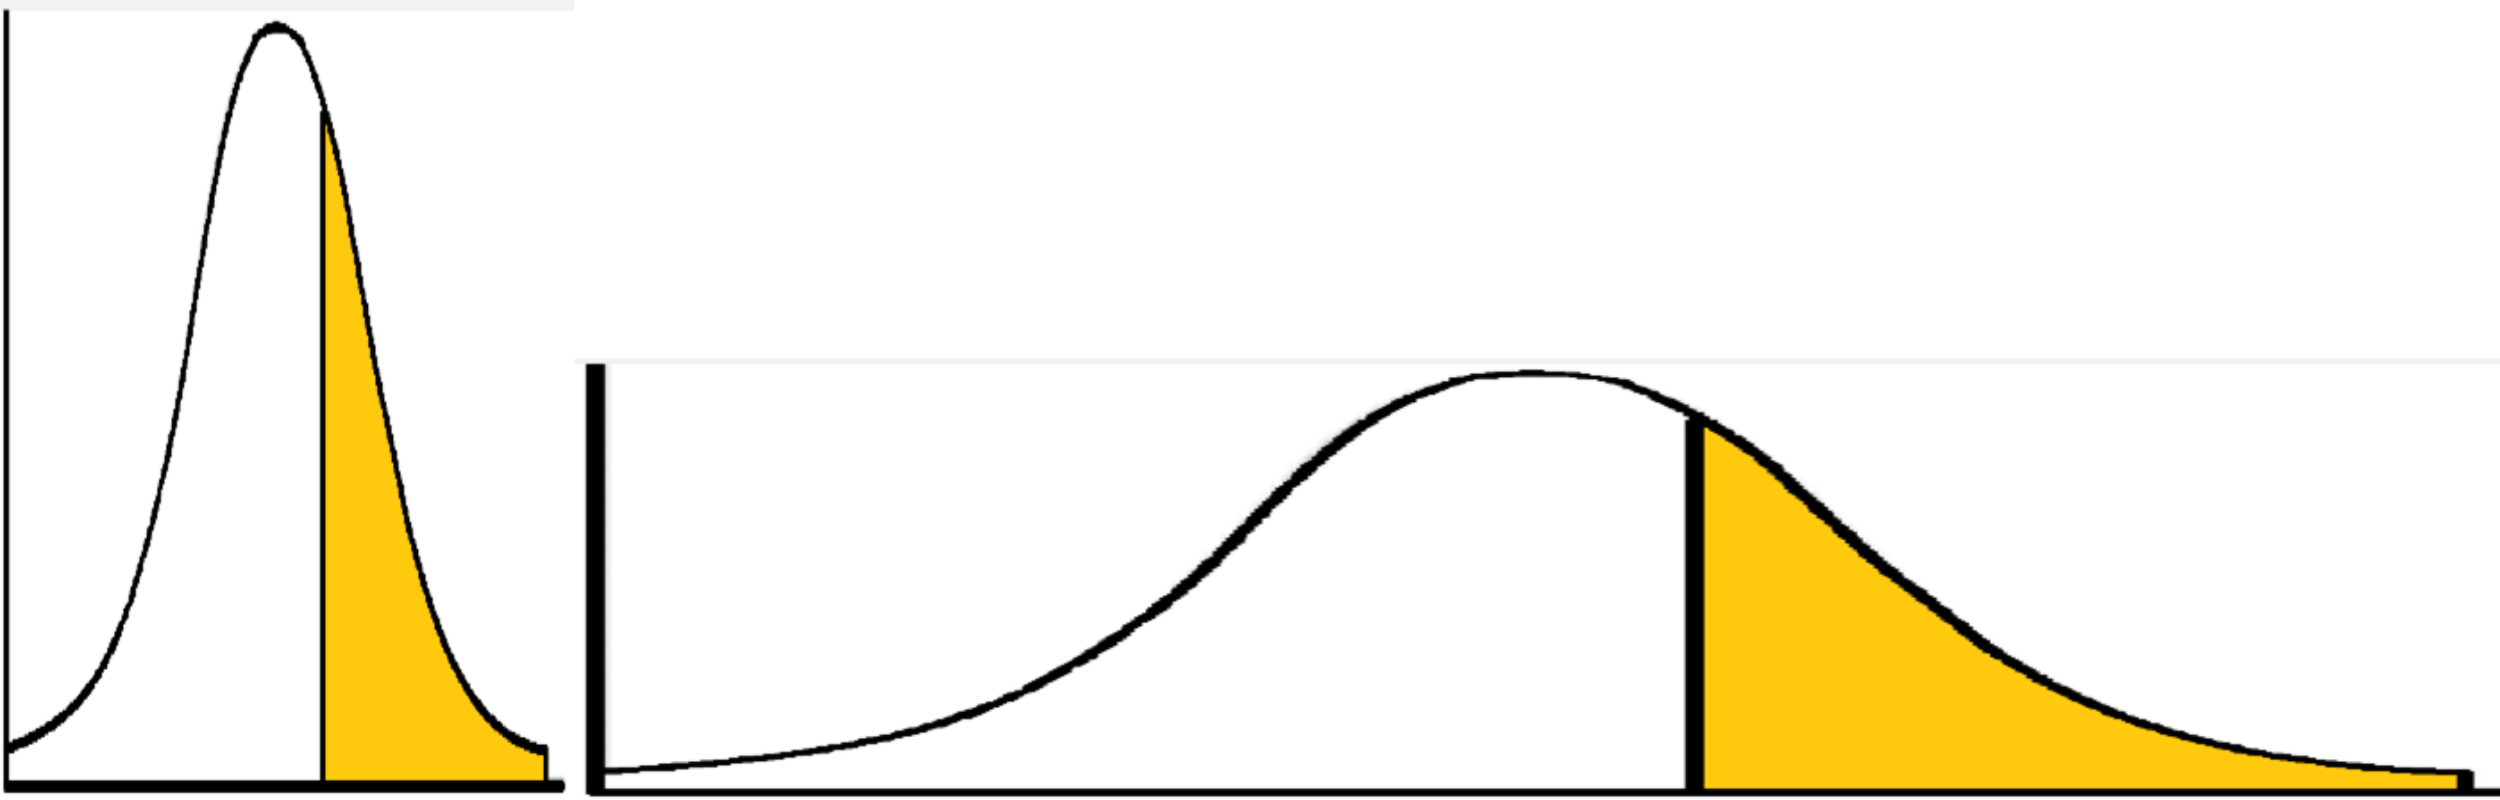
Increasing the genetic variation in the population can also increase the rate of genetic gain. With more variation, the bell curve stretches out (Figure 3). Assume the middle of the curve has the same mean, and 1 kg of difference is the same distance across both x axes. Both assume a selection of the top 30% of your ewe hoggets, but the difference is that you might be looking at 3-4 kg difference between the top and bottom of your selection for a population that has low levels of genetic variation (left). However, that could be nearer to 10 kg of difference between the top and bottom of your selection with high levels of genetic variation (right).
The easiest way to introduce new genetics to the flock is to buy from a different ram breeder, be that within the same breed or by introducing a new breed. Introduction of a new breed can also introduce hybrid vigour, a phenomenon where the average of the progeny is better than the average of the parents.
The final part of the equation is to decrease the generation interval. The generation interval is the average age of the parents at the time the lambs are born. Decreasing the generation interval increases the speed at which the new genetics are passed on. If a replacement lamb is born to a 5-year-old ewe, she is passing on superior genetics from 5 years ago, whereas a replacement lamb born to a 2-year-old ewe has superior genetics from 2 years ago (which will be more superior than those from the 5-year-old ewe).
Reducing the average age of the parents creates a greater rate of turnover, which can lead to greater genetic gain. Be aware that with reduced age, there can be a reduction in the accuracy of selection, depending on the traits that are being measured.
There are a few ways to decrease the average age of the parents:
There are many factors that contribute to the rate of genetic gain, but as long as the trait is heritable, and there is genetic variation in the population, progress can be made by using the selection tools available. Influencing the selection intensity, accuracy of selection, genetic variation and generation interval are the main ways to increase rates of genetic gain. With a bit of understanding about how it works, you can make small decisions on-farm to influence the genetic gains you see in your flock.
-----
Take a moment to head over to the neXtgen Agri Hub and share your thoughts on making genetic gain.

August 1, 2025
When I mention triplets to most farmers, I’m met with a mildly pained look, maybe even an eye-roll. It’s understandable; they’re difficult to manage, and as we improve production as an industry, each year we come across more and more of them …
Read moreJuly 25, 2025
Something that has always been interesting to me is watching people making big decisions at ram (and bull) buying times. I’m sure there could be an entire PhD written on this topic. Everyone is different, has different needs for their own farming …
Read moreJuly 11, 2025
If you've been watching the New Zealand bull sales and trying to match the data to the price, you'll be feeling somewhat confused. Sometimes the data sells - and sells well - and then, at other times, the correlation is less obvious. This can all ...
Read more